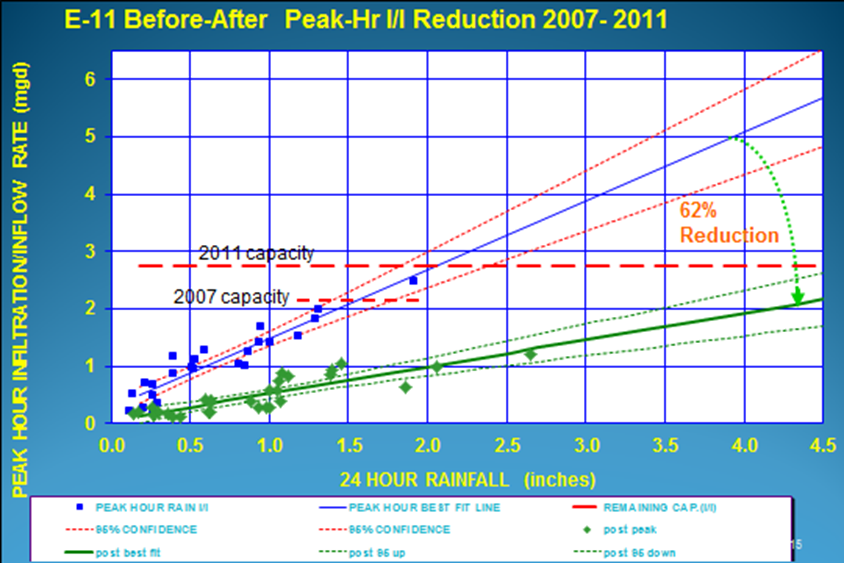
Figure 1. Peak-hour RDI/I Reduction Following Sewer Rehabilitation in Basin E-11.
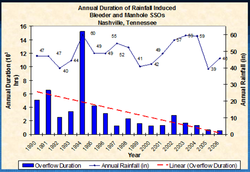
Figure 2. Nashville Reduction of Duration of Rainfall Induced Duration of SSOs Resulting from Rehabilitation.
The main reasons for conducting sewer rehabilitation for I/I reduction
are to recover capacity in the sewer system, and reduce or eliminate SSO
(Sanitary Sewer Overflows) events. When a system has SSOs then regulatory
agencies begin to act progressively in the form of NOVs (Notices of Violation)
and Administrative or Consent Orders. Sometimes these Orders may specifically
require sewer rehabilitation for addressing SSOs. However, from an enforcement
standpoint, regulatory agencies do not care how problems are corrected or how
much it costs. For these agencies, it is strictly a matter of compliance. In
many cases, the Orders require development and submission of a CAP-ER
(Correction Action Plan/Engineering Report – or some equivalent) which lays out
a plan to stop overflows. Such plans may propose new facilities, upsizing,
replacement, rehabilitation, or some combination of these actions.
When the customer load on a system (or a particular basin) has grown to
the point where most of the capacity is being used (perhaps 75% of the design
capacity), or where a facility has reached the end of its useful life, then replacement
or upsizing cannot be avoided. Otherwise, a program of well-planned sewer
rehabilitation is likely the least cost, long-term solution. This statement is
contingent on the level of effectiveness of I/I reduction that can be achieved
by sewer rehabilitation. The early, disappointing history of sewer
rehabilitation projects was discussed in Section 4 c iii of Chapter 1. However,
projects in the past 20 years using a strategic system approach (with good before-after
flow monitoring verification) have achieved aggregate results in the range of
49%. Table 1 summarizes the overall results from 29 projects in Nashville and
Brentwood, Tennessee for three significant I/I parameters. These projects
comprised a total of 97 miles of lining and rehabilitation of contiguous manholes
and service laterals (to the property line or easement line). (Kurz, 2012a;
Kurz et al, 2012b; Kurz, 2015)
Table 1. Summary Results of Effectiveness
for 97 miles of Sewer Rehabilitation.
I/I Parameter Reduction %
24-hour RDI/I (mgd)
79.5
51
Peak-hour RDI/I (mgd)
139.5
48
Annual I/I (MG/year)
3,835
47
The RDI/I parameters (24-hour RDI/I and Peak-hour RDI/I) were
standardized based on the 5-year, 24-hour rainfall event recurrence for middle
Tennessee. That event has a depth of 4.5 inches. Additionally, each analysis
compiles the results as a straight-line linear regression in the form of
y=ax+b. Using this standardization technique allows comparison with programs
that may use a different 24-hour design storm. The Peak-hour RDI/I is the best
parameter for evaluating progress with SSO reduction. Annual I/I is a good
parameter for evaluating O&M (Operation and Maintenance) cost savings. Practical
applications will be illustrated in following sections.
Capacity and Capacity Recovery
Recovering sewer capacity by removing excess flow is intuitive.
However, there are some interesting ways to analyze and depict this process. (Kurz,
1997) Figure 1 shows comparable graphs of projected peak-hour RDI/I before and
after sewer rehabilitation in basin E-11 in Brentwood. There was an overall
reduction of 62% for the peak-hour RDI/I flows. These projections are shown in
comparison to the available remaining capacity for RDI/I (the ADDWF – Average
7-day Dry Weather Flow hydrograph has already been subtracted from the storm
event results). The peak-hour RDI/I before rehabilitation was about 5.6 mgd and
the intercept with the 2007 capacity line shows that the pipe was likely to
surcharge for storms greater than 2 inches in 24 hours. After rehabilitation,
the peak-hour RDI/I was reduced to about 2.1 mgd (a 62% reduction).
Additionally, when this was compared to the remaining capacity threshold
(recalculated from the 2011 ADDWF), then it is clear that the capacity has been
increased by about 0.7 mgd, and that this pipe is not likely to surcharge from
RDI/I from the 5-year, 4.5 inch storm. This picture is not perfect, however. In
this case, the E-11 meter is close to a trunk line which is influenced by I/I
and ocassionally backs up and causes the E-11 meter to record a surcharge.
ABOVE - left side bar
Figure 1.Peak-hour RDI/I
Reduction Following Sewer Rehabilitation in Basin E-11.
SSO Reduction
Theoretically, federal regulations do not allow any SSOs from sanitary
sewer systems under any conditions. From a practical standpoint, there is a
possibility that any manhole low in a sewer system could overflow under the
right rainfall or flooding conditions. It is not economical to design a gravity
system that is leak-proof under any rainfall conditions. Therefore, it is
useful to use the hydrologic approach of rainfall recurrence interval depths to
define a “design storm”. As an example, the five-year, 24-hour rainfall event
was used in Nashville for design purposes and to define overflows for
corrective action. Early in the program, a list was compiled of overflow
complaints that resulted in defining 137 locations for elimination. After the
system was modeled, additional locations were identified for potential oveflows
under the design storm conditions. Usually, these were in remote locations where
direct observation was unlikely. Field inspections were conducted, and a final
list of 167 SSO locations was accepted. By 2005, this list had been reduced to
27 (84% reduction) as a result of 324 miles of sewer rehabilitation (about 15%
of the whole system). (Kurz, et al 2000a & 2000b; Kurz, 2012b) Many of the
overflowing manhole type SSOs could not be properly monitored. However, the
duration of overflows was tracked and the yearly results are shown in Figure2.
The annual rainfall is also shown on the graph. While there is not a perfect
relationship between annual rainfall depth and annual I/I, some of the annual
fluctuation shows a rough correspondence. A good example for comparison is the
maximum duration measured in 1994 when there was 60 inches of rainfall compared
to two similar later years a decade later with significantly shorter durations.
ABOVE - LEFT SIDEBAR
Figure 2.Nashville Reduction of
Duration of Rainfall Induced Duration of SSOs Resulting from Rehabilitation.
Cost of Alternatives
There is controversy (or at least uncertainty) today about the efficacy
and economy of different approaches to providing adequate capacity and
eliminating SSOs in sanitary sewer systems. Not much is publicly written, but
the effects of this uncertainty are apparent in the widely varying approaches
to developing corrective action plans to eliminate SSOs. These approaches may
be characterized generally as:
Bigger is better,
Detention or equalization tanks
Sewer rehabilitation
Some combination of the above approaches
The engineer’s decisions to select any particular approach (or mix of
approaches) on this list are likely to be highly influenced by their perception
of different levels of effectiveness. If the perception is that rehabilitation
is only effective for confidently removing 25% to 30% of the I/I, then
decisions will likely shift more towards new construction. However, if the
designer is confident about removing 50%-55% of the excess flow, then
rehabilitation looks more desirable. The shift in these factors may not make
much difference in the economic analysis of construction costs. However, when
the long-term costs are considered of allowing I/I to remain in the system
rather than eliminating it, then this difference of perception takes on a
greater significance. A dramatic example of that difference was shown in the
Brentwood rehabilitation program where the cost of the whole program will be
recouped in about 12 years from savings on the metered flow to Nashville for
treatment. Additionally, a long-term economic analysis should include the
O&M costs on any new facilities. In summary, system managers should
consider long-term costs associated with various decisions in addition to
expeditiously correcting the immediate problems of SSOs.
REFERENCES
Kurz, G., Woodard, S. (2000a) Impacts of Overflow
Reduction Resulting From Sewer Renewal, ASCE Convergence 2000, July, 2000, Kansas
City, MO.
Kurz, G., Woodard, S., Ballard, G. (2000b) Nashville
Cuts Wet Weather SSOs Using Sewer Rehabilitation, WEF Urban Wet Weather
Conference, May 2000, Rochester, NY.
Kurz,
G. (1997), Predicting I/I Reduction for Planning Sewer Rehabilitation, ASCE
International Pipeline Congress, June 1997 Boston, MA
Kurz, G.
(2012a) An I/I Program Case History:
Nashville Removes 3.6 Billion Gallons of I/I and 137 SSOs, UCT 2012 Sewer Strategies Rehab
Workshop, January 25, 2012, San Antonio, Texas.
Kurz, G.,
Milton, C., Colvett, K., Muirhead, D., (2012b) Sewer Rehabilitation Pays in Brentwood Tennessee, No-Dig 2012, March 11-15, 2012,
Nashville, Tennessee.
Kurz, G, (2015) Unpublished Updates for Ongoing
Projects.